UC2 – Agriculture and Biodiversity Nexus#
Overview#
UC2 investigates how farming activities impact biodiversity in agricultural landscapes. It focuses on farmland birds as indicators of ecosystem health, aligning with European Green Deal priorities. The approach combines Earth observation data, environmental indicators, and farm management information in a data cube, using machine learning to identify patterns and causal relationships. The goal is to enable more nature-inclusive farming practices through interpretable, actionable insights.
Objectives#
UC2 aims to improve understanding of how different farming practices influence biodiversity at landscape scale. Its key research questions include:
- Can the integration and ML-based analysis of currently available biodiversity, agriculture, environmental, and remote sensing data provide comprehensive, verifiable, and actionable insights for different regions?
- Can datacube functionality and ML help in finding patterns between effects of farm level measures, indicators of physical conditions and direct measures of biodiversity?
- Can the insights obtained in the study region be extended to other regions, learned patterns reused by applying transfer learning?
Data#
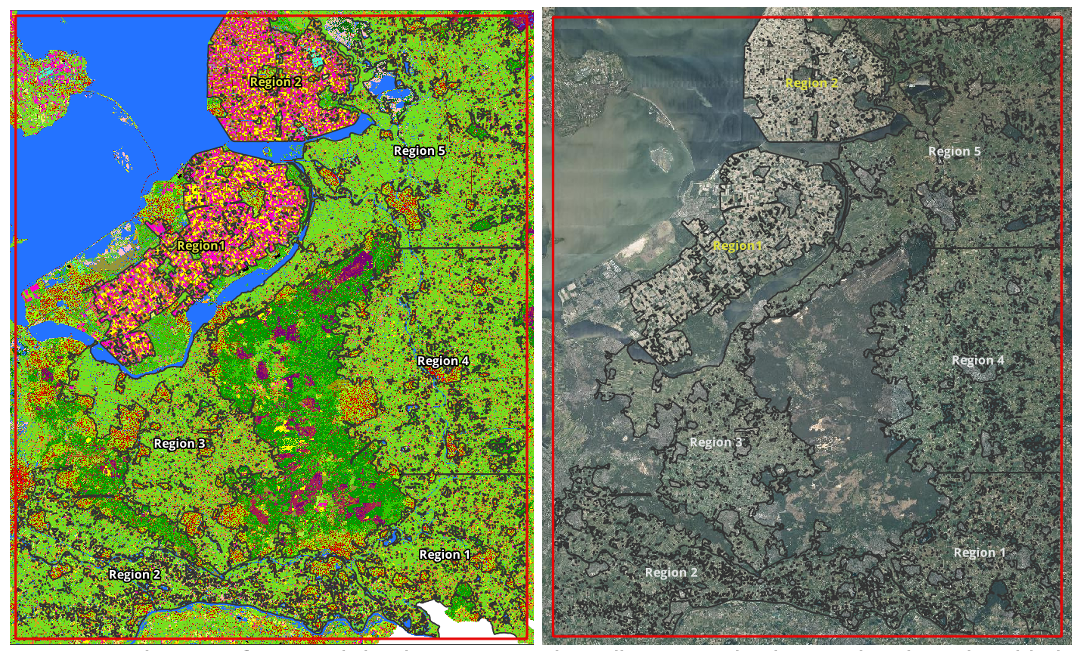
UC2 uses three primary data categories over a study area (~90×110 km) in the central Netherlands:
- Biodiversity data: Farmland bird observations from the NDFF, aggregated to derive species distribution and richness maps.
- Agricultural data: Field-level crop types, mowing intensity, and the Crop Rotation Index from AgroDataCube.
- Environmental data: CORINE land cover, Copernicus Small Woody Features, Sentinel-2 NDVI mosaics, local weather, and terrain.
Data were harmonized into a 10m raster format, aligned spatially and temporally (snapshots for 2014, 2018, and 2022), and ingested into the Rasdaman data cube.
Approach#
The UC2 workflow follows three main steps:
-
Data Integration
All datasets were preprocessed and ingested into the FAIRiCUBE Rasdaman-based data cube platform (see D2.1, D2.3). Vector farm and biodiversity data were rasterized; cloud-free Sentinel-2 NDVI mosaics were generated. -
Biodiversity Index Modeling
Species occurrence data were transformed into abundance grids and extended using Species Distribution Modeling (SDM) via theelapidMaxEnt implementation. A composite biodiversity index (species richness) was created. -
Causal Machine Learning
Using theDoWhylibrary, a causal model was built with crop rotation as treatment and species richness as outcome. The causal effect was estimated and validated through refutation testing.

Results#
- Key finding: A positive causal relationship was confirmed between the Crop Rotation Index and bird species richness. Fields with more diverse crop rotation support higher biodiversity.
- Robustness: Refutation tests showed minimal deviation when using random treatment variables, reinforcing confidence in the result.
- Deliverables: The methodology, data pipelines, FAIR data outputs, and reusable workflows are published on Zenodo and via the FAIRiCUBE Hub.
These results provide a standardized, reproducible method for biodiversity monitoring and demonstrate how FAIR-compliant AI tools can guide nature-positive agricultural practices.
Tools#
- Platform: Rasdaman data cube engine via FAIRiCUBE Hub, using WCPS for querying and subsetting.
- Processing: Python-based workflows using
gdal,geopandas,rasterio, andnumpyfor EO preprocessing. - ML libraries:
elapid(for SDM),DoWhy(for causal inference). - Visualization: Outputs are shareable via FAIRiCUBE tools and standard GIS platforms.
All code and notebooks are accessible via the FAIRiCUBE GitHub and documented in Deliverables D3.3 and D3.5.
Partners#
Led by Wageningen Environmental Research (WENR), UC2 combines agro-ecological expertise with FAIRiCUBE’s technological capabilities. Collaboration with NILU and other partners ensures integration of advanced analytics and FAIR principles.